


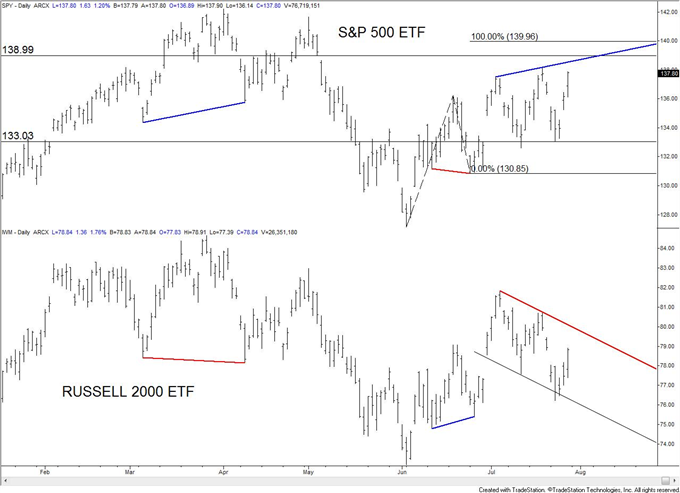
US equity indexes continue to chop up participants (see explanation from 2 weeks ago on the purpose this serves) as the SPY is at its highest since 5/3. In fact, the S&P 500 (SPY ETF shown) has closed the gap at 138.99 (not shown on this chart which was taken earlier). However, the Russell 2000 (IWM ETF) is well below its July high and closing in on its short term trendline. In other words, the broad index of small cap stocks is not confirming the new high in the narrow index of the 500 largest companies.
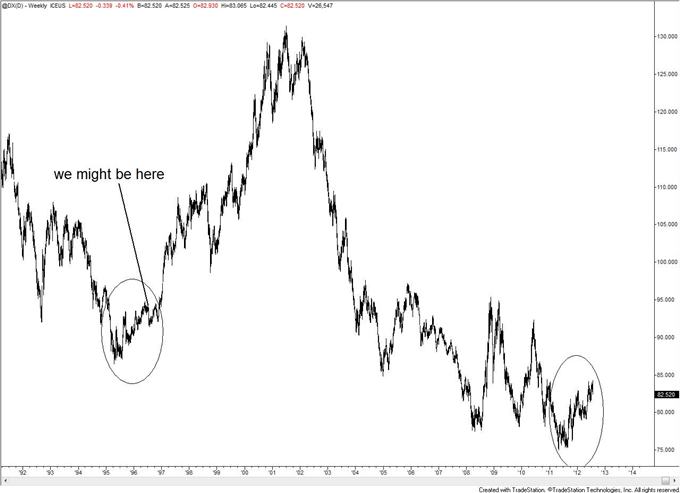
US Dollar Index (ICE) Continuous Contract Weekly
Prepared by Jamie Saettele, CMT
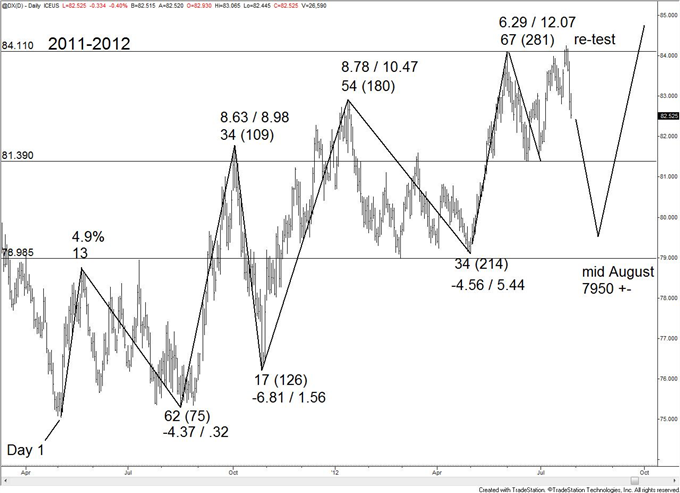
I’m still following the 1995/96 USD model. IF the current market follows the 1995/96 model then expect weakness into mid-August below 8139. 8082 is former resistance and now potential support. Allow for strength early next week above 8307. The 1995/96 market endured a deep retracement (in late July and early August of 1996) that nearly touched the previous swing low (February 1996 low). If that happens this time around, then weakness would extend below 80 but a bottom would form before the February low of 7899.
US Dollar Index (ICE) Continuous Contract Daily
Prepared by Jamie Saettele, CMT
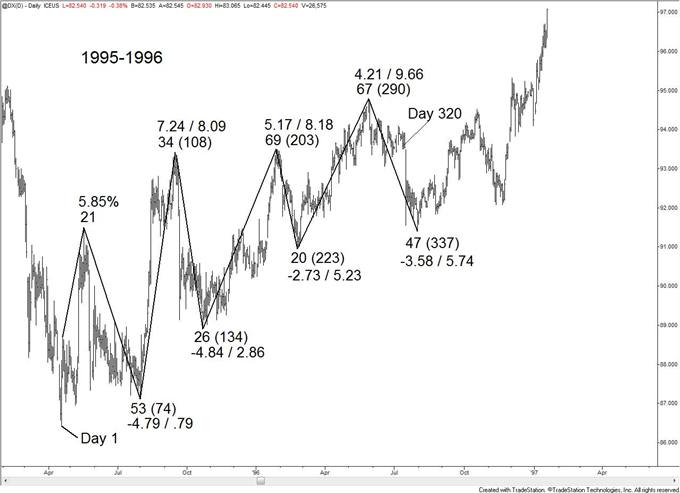
“The relationship between the US Dollar Index in 1995-1996 and now was pointed out to me by ElliottWave-Forecast. The charts tell the story and it’s uncanny. Not only do the patterns show remarkable similarity in form, but also in time and amplitude. The first number denotes the number of days that the specific leg consumed. The second number in parentheses denotes the number of days since the start of the pattern. The numbers with decimal points are percentage and measure the change from low to high of each leg in the pattern with the number after the slash measuring the net change from the start of the pattern. If the pattern continues (and there is no guarantee that it will of course), then the USD would trade sideways to down throughout July and August before bottoming just above the March low. This should be interesting to follow.”
Prepared by Jamie Saettele, CMT
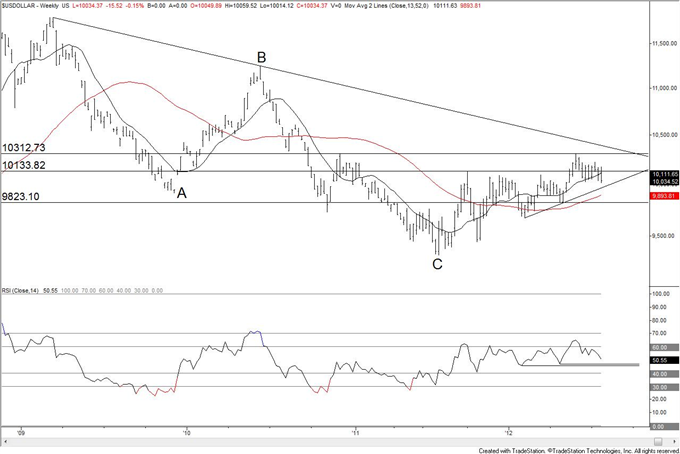
Dow Jones FXCM Dollar Index (Ticker: USDOLLAR)
Weekly
Prepared by Jamie Saettele, CMT
Jamie – The Dow Jones FXCM Dollar Index (Ticker: USDOLLAR) has traded to its lowest since 5/11 and the index may slip lower still next week. Focus is a short term internal downward sloping channel and 100% extension of the decline from the July high at 9986. The trendline that extends off of the 2012 lows is at about 9970 next week. A deeper decline into mid-August (as per the 199/96 model) could reach the 100% extension of the decline from the June high at 9940. Allow for corrective strength above 10060 but look lower over the coming weeks.
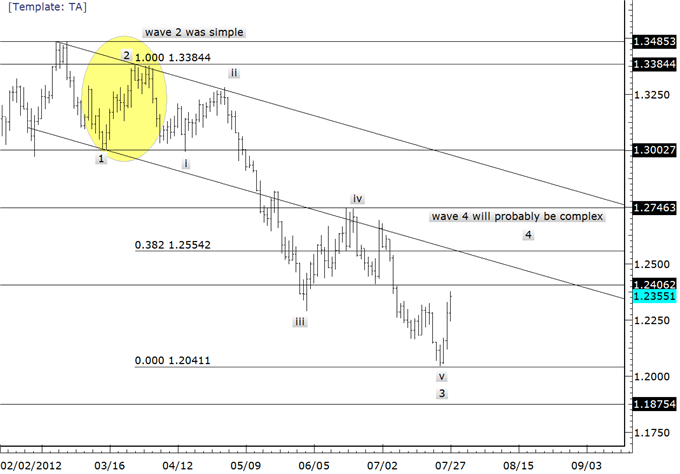
Euro / US Dollar
Prepared by Jamie Saettele, CMT
Jamie –The anticipated reversal has materialized in the EURUSD and we can now focus on how far the rally is likely to extend. Elliott wave guidelines state that wave 4 often alternates with wave 2 of the same degree with respect to character. In other words, if wave 2 is sharp and simple then expect wave 4 to be shallow and complex. Wave 2 (13003-13384) was sharp (retracing 78.6% of wave 1) and simple (3 wave zigzag) thus we should expect wave 4 to be shallow and complex. Shallow means a 38.2% retracement of wave 3, which comes in at 12554. The former 4th wave of one less degree is also of interest at 12746. The bullish wave count (for at least a few weeks) is bolstered by this week’s key AND outside reversal. This is the first such reversal since the second week of 2011. Near term, I favor buying on a dip early next week between 12175 and 12215.
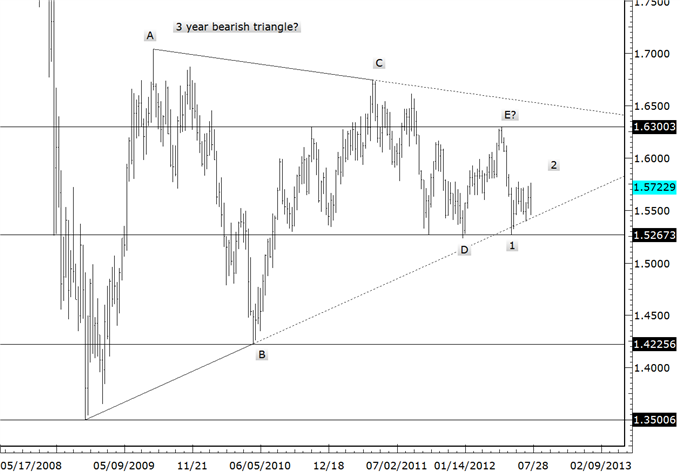
British Pound / US Dollar
Weekly
Prepared by Jamie Saettele, CMT
Jamie –15900 remains a level of interest. To review, “15900 is the 100% extension of the rally from 15267 and 61.8% retracement of the decline from 16300.” After Thursday’s surge, a tag of 15900 may be in the cards earlier than thought. The level intersects channel resistance on Tuesday. An aggressive target of 16105, the 161.8% extension of the rally from 15392 (beginning of wave c?), must also be considered in light of the EURUSD bullish implications. 15550 and 15610 are supports.
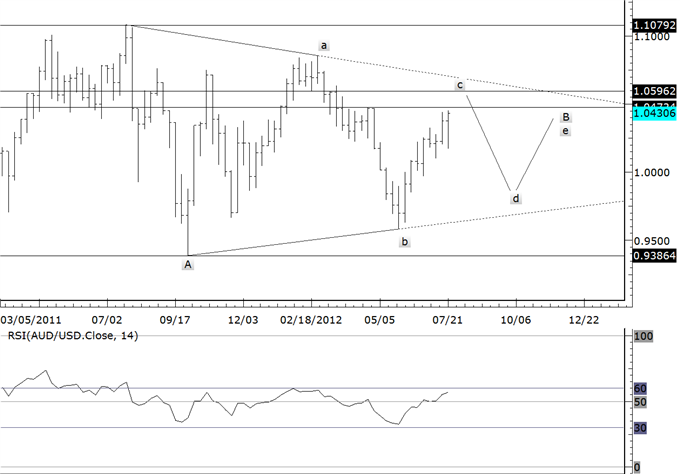
Australian Dollar / US Dollar
Weekly
Prepared by Jamie Saettele, CMT
Jamie – The swings since the 2011 high compose a triangle. The NZDUSD pattern makes it more likely though that the triangle is not bullish but rather forming from the October 2011 low as wave B within an A-B-C decline from the 2011 high. Without getting into the nitty-gritty of wave structure within the advance from the 6/1 low, levels to consider for a top are 10475 (4/27 high), the line that extends off of the 7/5 and 7/19 highs and 10600 (extensions and 2/23 low). The 10600+ idea makes the most sense given the 1995/1996 USD model and EURUSD wave count. Support is 10345/85.
US Dollar / Japanese Yen
Daily Bars
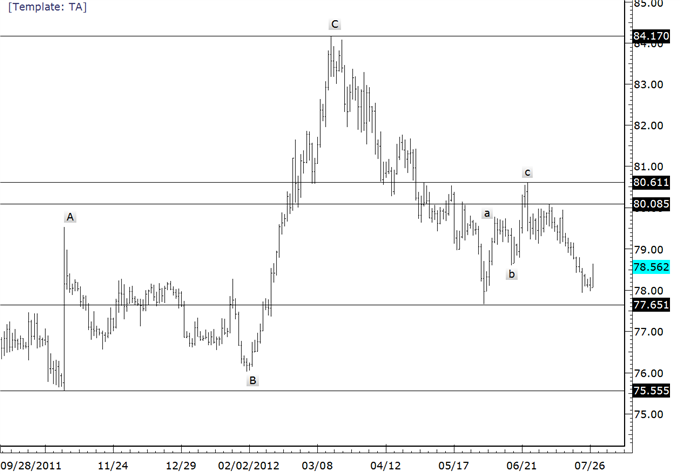
Prepared by Jamie Saettele, CMT
Jamie – Quite simply, the 3 wave rally from 7765 leaves 7765 vulnerable. The decline from 8061 appears to be unfolding in an impulsive manner (wave 3 extended). As such, strength should prove corrective and give way to new lows. Resistance is clustered between 7868/80 (former pivots and 38.2% retracement). The bottom of this zone was reached today so it’s time to start looking lower again. Bigger picture, notice that the rally from the 2011 low is also in 3 waves. The implications are for an eventual drop to another all-time low (3 wave moves can also start larger corrections such as triangles, flats, and complex patterns however).
Gold (spot)
Daily Bars
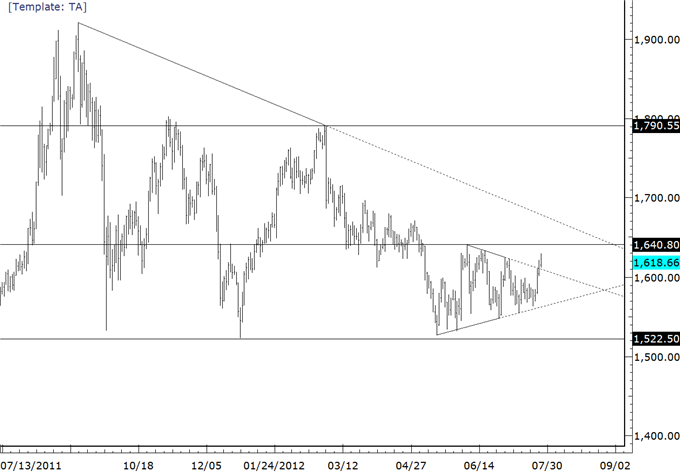
Prepared by Jamie Saettele, CMT
Jamie – Gold has cleanly broken through its triangle pattern. I had pegged the action in recent months as a bearish triangle but was proven wrong today with the move above the resistance line and 7/3 high. One must respect the bullish break and respect potential for a move back towards (not necessarily above) the 2012 high of 1790.55. The February low is of interest just above 1700.


No comments:
Post a Comment