


08 May 2012 16:14 GMT  Daily Winners and Losers


The Japanese yen is the top performer against a stronger dollar at the close of European trade with an advance of 0.07% on the session. Risk aversion is in full effect in early US trade with global equity markets off sharply as ongoing concerns about the deepening crisis in Europe fueled haven flows into the yen and the dollar, keeping the pair well supported above the 100-day moving average at 79.65. Greece has come back into focus with the results of this weekend’s elections yielding no victor after voters rejected both parties. With the failure of officials to form a coalition government, attention now shifts to the weeks ahead when the nation will need to ensure that it is achieving its budgetary targets before receiving the next tranche of aid from the Troika. With calls for a Greek exit of the euro once again resurfacing, look for broader market sentiment to remain on the defensive as contagion fears take root.
The USDJPY has continued to trade within the confines of a descending channel formation off the March highs with the exchange rate holding just below the 50% Fibonacci retracement taken form the February advance at 79.90. While our medium-term bias on the pair remains weighted to the topside, we note favorable long entries between the 61.8% retracement at the 79-figure and the 100-day moving average at 79.65 with our objective eyed at the 23.6% extension just shy of the 82 figure.

The scalp chart shows the USDJPY breaking back below the 61.8% Fibonacci extension taken form the April 1st and 20th crests at 79.90 before encountering soft support at 79.70. A more substantiated move into risk aversion risks further downside pressure with a break below interim support eyeing subsequent floors at the 78.6% extension at 79.40, 79.20 and the 79.Figure. Interim topside resistance now stands at 79.90 backed closely by 80.10, the 50% extension at 80.26 and the 38.2% extension at 80.62. A confirmed break above channel resistance (on a close basis) would invalidate our bias with such a scenario eying topside levels at 80.85 and the 23.6% extension at 81.06.
Key Levels/Indicators


The Australian dollar is the weakest performer against the greenback with a decline of more than 0.83% on the session. Weaker-than-expected trade balance figures out of Australia last night weighed heavily on the aussie with the print showing a deficit of 1587M, grossly missing consensus estimates that called for a deficit of just 1300M. The data marks the largest trade deficit in Australia since October of 2009 and with ongoing concerns about a slowdown in China, the aussie is likely to remain under pressure. The pair remains within the confines of a descending channel formation dating back to March 6th with the aussie testing channel support at the 1.01-handle in early US trade. Our primary weekly objective remains the 78.6% Fibonacci retracement taken form the December advance at 1.0074 with former trendline resistance dating back to July 2011 resting just below. Note that daily RSI is now at its lowest levels since November 25th with further losses for the aussie expected in the weeks ahead.

The scalp chart shows the pair trading within the confines of a descending channel formation dating back to the April 27th highs with the aussie breaking below soft support at 1.0115 before rebounding off the 38.2% Fibonacci extension taken from the April 27th and May 7th crests at 1.0088. We continue to favor selling into aussie rallies with a break back below this level eyeing downside support targets eyed at 1.0075, the 50% extension at 1.0050, 1.0025, and the 61.8% extension just above parity. Topside resistance stands at the 23.6% extension at 1.0140 backed by 1.0170, and 1.0190. A breach above our Fibonacci reference point at 1.0220 invalidates this specific setup with such scenario eyeing key resistance at 1.0240 (61.8% Fib Retracement on daily chart).
Key Levels/Indicators
Daily Winners and Losers
The Japanese yen is the top performer against a stronger dollar at the close of European trade with an advance of 0.07% on the session. Risk aversion is in full effect in early US trade with global equity markets off sharply as ongoing concerns about the deepening crisis in Europe fueled haven flows into the yen and the dollar, keeping the pair well supported above the 100-day moving average at 79.65. Greece has come back into focus with the results of this weekend’s elections yielding no victor after voters rejected both parties. With the failure of officials to form a coalition government, attention now shifts to the weeks ahead when the nation will need to ensure that it is achieving its budgetary targets before receiving the next tranche of aid from the Troika. With calls for a Greek exit of the euro once again resurfacing, look for broader market sentiment to remain on the defensive as contagion fears take root.
The USDJPY has continued to trade within the confines of a descending channel formation off the March highs with the exchange rate holding just below the 50% Fibonacci retracement taken form the February advance at 79.90. While our medium-term bias on the pair remains weighted to the topside, we note favorable long entries between the 61.8% retracement at the 79-figure and the 100-day moving average at 79.65 with our objective eyed at the 23.6% extension just shy of the 82 figure.

The scalp chart shows the USDJPY breaking back below the 61.8% Fibonacci extension taken form the April 1st and 20th crests at 79.90 before encountering soft support at 79.70. A more substantiated move into risk aversion risks further downside pressure with a break below interim support eyeing subsequent floors at the 78.6% extension at 79.40, 79.20 and the 79.Figure. Interim topside resistance now stands at 79.90 backed closely by 80.10, the 50% extension at 80.26 and the 38.2% extension at 80.62. A confirmed break above channel resistance (on a close basis) would invalidate our bias with such a scenario eying topside levels at 80.85 and the 23.6% extension at 81.06.
Key Levels/Indicators
|
Level/Indicator
|
Level
|
|
200-Day SMA
|
78.39
|
|
100-Day SMA
|
79.65
|
|
50-Day SMA
|
81.64
|
|
2012 JPY High
|
76.02
|
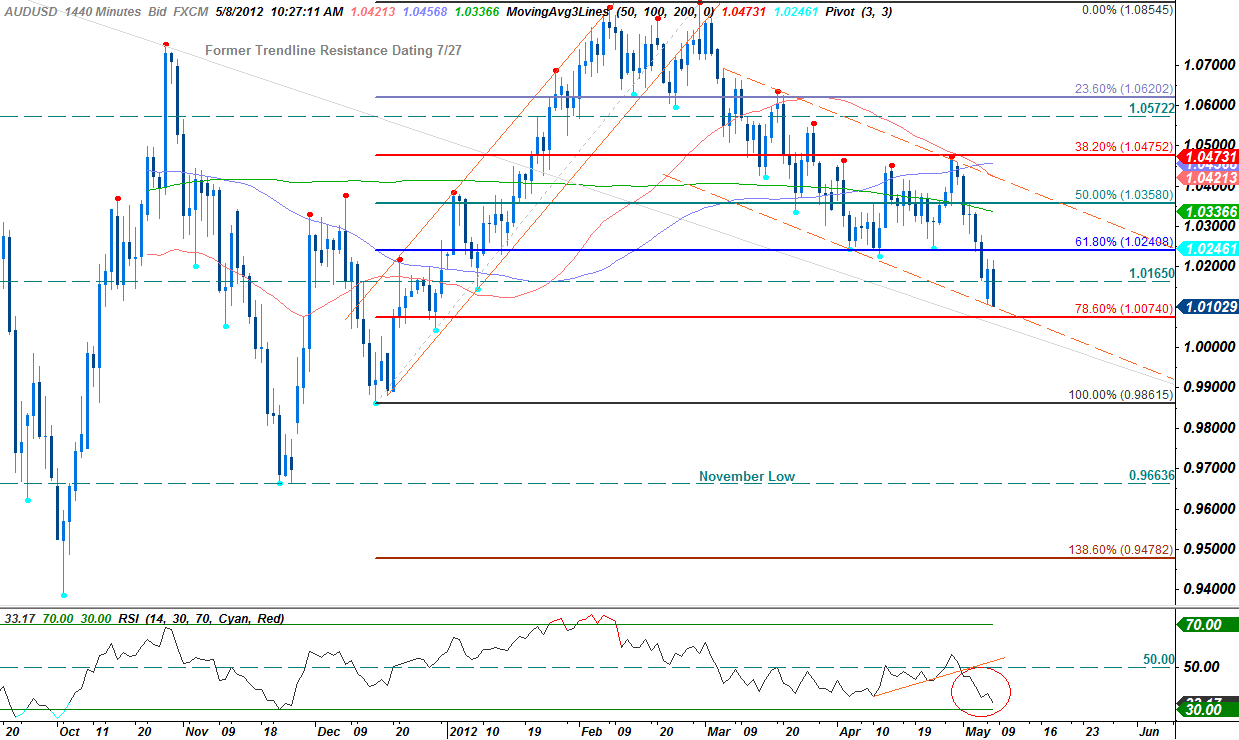
The Australian dollar is the weakest performer against the greenback with a decline of more than 0.83% on the session. Weaker-than-expected trade balance figures out of Australia last night weighed heavily on the aussie with the print showing a deficit of 1587M, grossly missing consensus estimates that called for a deficit of just 1300M. The data marks the largest trade deficit in Australia since October of 2009 and with ongoing concerns about a slowdown in China, the aussie is likely to remain under pressure. The pair remains within the confines of a descending channel formation dating back to March 6th with the aussie testing channel support at the 1.01-handle in early US trade. Our primary weekly objective remains the 78.6% Fibonacci retracement taken form the December advance at 1.0074 with former trendline resistance dating back to July 2011 resting just below. Note that daily RSI is now at its lowest levels since November 25th with further losses for the aussie expected in the weeks ahead.
The scalp chart shows the pair trading within the confines of a descending channel formation dating back to the April 27th highs with the aussie breaking below soft support at 1.0115 before rebounding off the 38.2% Fibonacci extension taken from the April 27th and May 7th crests at 1.0088. We continue to favor selling into aussie rallies with a break back below this level eyeing downside support targets eyed at 1.0075, the 50% extension at 1.0050, 1.0025, and the 61.8% extension just above parity. Topside resistance stands at the 23.6% extension at 1.0140 backed by 1.0170, and 1.0190. A breach above our Fibonacci reference point at 1.0220 invalidates this specific setup with such scenario eyeing key resistance at 1.0240 (61.8% Fib Retracement on daily chart).
Key Levels/Indicators


