


“THE MARKET(S)” a.k.a. “RISK” – Weekly Bars
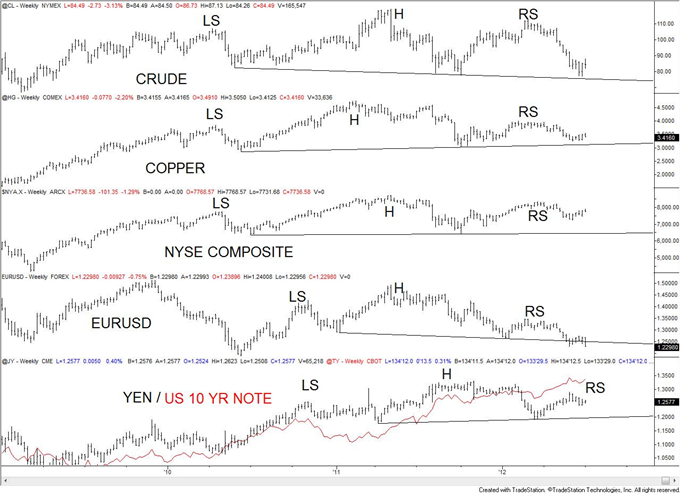
I’ve shown this chart for 3 weeks now (and similar charts since March) but it’s worth a look each week if for no other reason than to remind ourselves that decoupling is a myth; that capital markets remain USD centric and fluctuate with the expansion and contraction of USD denominated credit.
“The story being told by markets remains one of slowing global economic growth. Interest in the story is on the rise as key markets such as crude oil and copper approach multiyear support lines (head and shoulders necklines). The downward sloping neckline on crude portends an especially weak market (Some may take issue with this because these charts are of continuous futures, rather than spot. The crude spot market shows a much higher right shoulder and upward sloping trendline but does indeed show a multiyear topping pattern). Breaks of these long term supports will probably trigger the panic portion of the story in the coming weeks and months.
Of particular interest to FX traders is the emergence of topping patterns in both the Euro and Japanese Yen (Yen futures shown to correlate with EURUSD). Both currencies have been carving out topping patterns since late 2010. Viewed through this lens, it’s not out of the question that we’ll soon see a much stronger USD against both the Euro and Yen (and a more or less sideways EURJPY). Specific to the Yen, the divergence between the Yen (not a new record high) and 10 year Treasury note (new record high) remains in place and is characteristic of long term reversals.”
S&P 500 Index ETF (SPY)
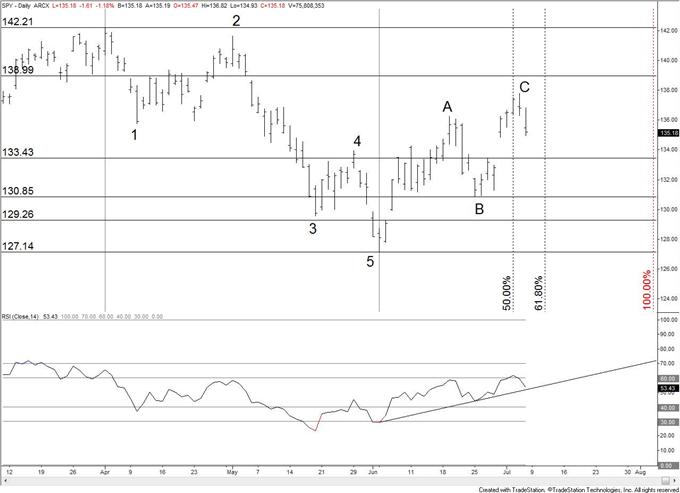
Remember last Friday’s rally? The S&P traded below last Friday’s open today. Early in June, I suggested 2 topping dates based on common time relationships seen at previous tops. The dates were 6/21 and 7/3-7/4. I was confident that the top was in on 6/19 after the 6/21 drop but Ms. Market, always with a trick up her sleeve, had other plans. Once again, the information that I rely on (pattern, sentiment, momentum) suggests that a top is in place. I am more confident this time as the rally from June is 1 day removed from a 50% relationship in time with the decline from April, July’s opening range has been resolved to the downside (which was not the case in June), and daily RSI has rolled over after poking above 60. The only thing that worries me as a bear is sentiment. The mainstream media acts as if the world is ending each time the S&P falls 10 handles. Words like ‘crumble’ and ‘plunge’, usually in capital letters, populate the Twittersphere. This psychology is more consistent with bottoms than tops. By the same token, each 10 handle rally in the S&P brings out bullish prognosticators in droves. Maybe the extreme changes in sentiment over short periods of time presage drastic market moves. The thought fits the Elliott wave model in which the majority sells out at the wave 1 low (after 1-2-3-4-5 down) and gets caught turning bullish at the wave 2 high (after A-B-C up).
S&P 500 Index ETF (SPY)
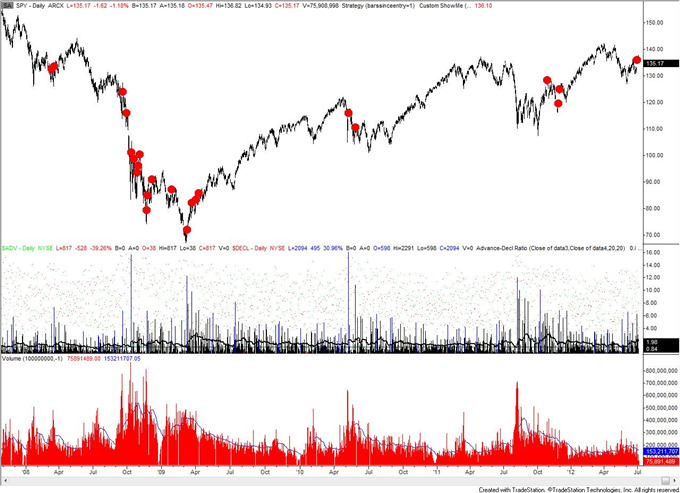
The red dots indicate days when the market opens UP at least 1.8% and closes the day UP at least 2.5%. The conditions were met last Friday for the first time since December although last Friday is more similar to 10/27/11 in that both days took place one month after lows were registered. Near term focus is on the 6/25 and 6/4 lows about 40 and 85 handles lower. In general, such conditions are more likely to be met in bear markets (as the chart indicates).
US Dollar Index (ICE) Continuous Contract Weekly
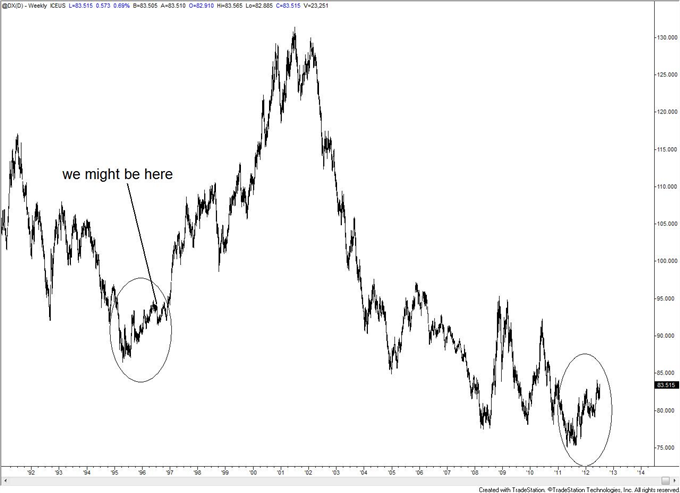
I’m still following the 1995/96 USD model. IF the current market follows the 1995/96 model then expect weakness from near current levels. In the event that the current market starts to deviate significantly from the 1995/96 model, then I’ll abandon the idea.
US Dollar Index (ICE) Continuous Contract Daily
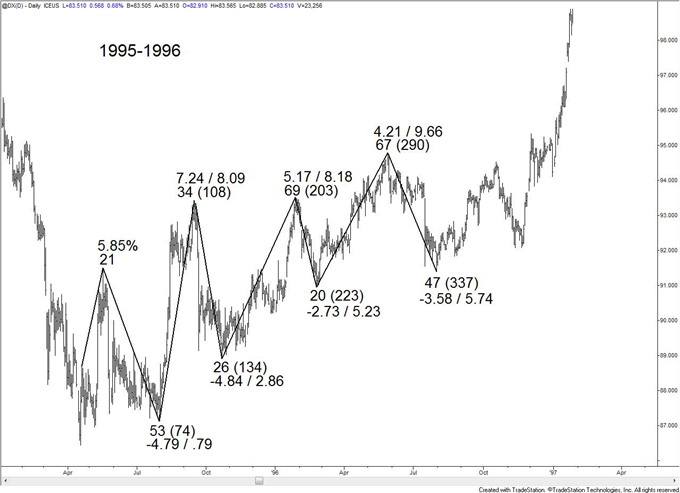
The relationship between the US Dollar Index in 1995-1996 and now was pointed out to me by ElliottWave-Forecast. The charts tell the story and it’s uncanny. Not only do the patterns show remarkable similarity in form, but also in time and amplitude. The first number denotes the number of days that the specific leg consumed. The second number in parentheses denotes the number of days since the start of the pattern. The numbers with decimal points are percentage and measure the change from low to high of each leg in the pattern with the number after the slash measuring the net change from the start of the pattern. If the pattern continues (and there is no guarantee that it will of course), then the USD would trade sideways to down throughout July and August before bottoming just above the May low. This should be interesting to follow.”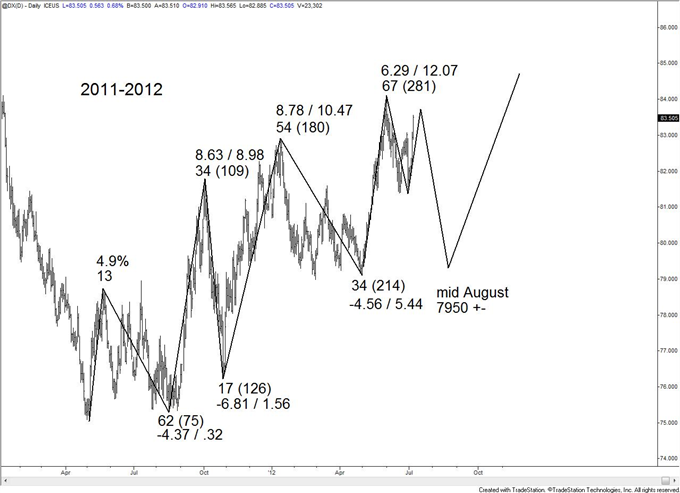
Australian Dollar (CME) Continuous Contract 240 Minute
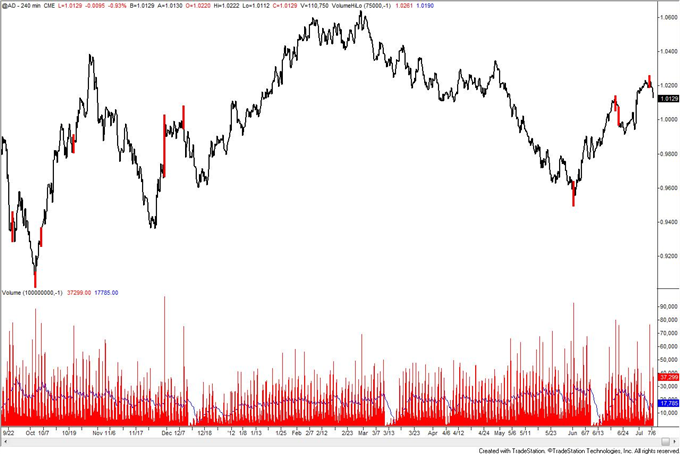
The potential AUDUSD capitulation as indicated by elevated CME volume was mentioned yesterday. The high remains in place which increases the confidence in the top and reversal idea.
Dow Jones FXCM Dollar Index (Ticker: USDOLLAR)
Weekly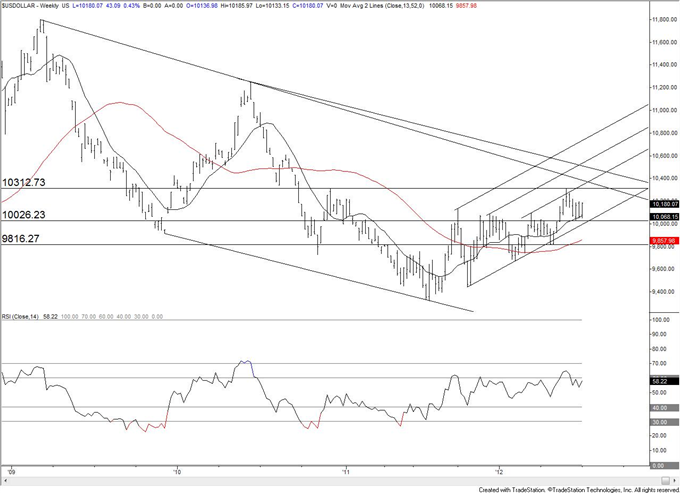
Jamie – I wrote last week that “the Dow Jones FXCM Dollar Index (Ticker: USDOLLAR) is pressing against the April high at and 13 week moving average. The 40 level acting as support in RSI is a bull market characteristic as well on the daily. Given implications from the SPY analysis and US Dollar 1995-1996 similarity, I’d not be surprised to see a strong USD in early July followed by weakening thereafter. The implications next week are for a move back towards 10200.” The USDOLLAR reached 10187 today. Early week focus is still higher towards 10220/40, which is a zone likely to produce a reaction (at least a pullback lower). 10130/55 is support.
Euro / US Dollar
Weekly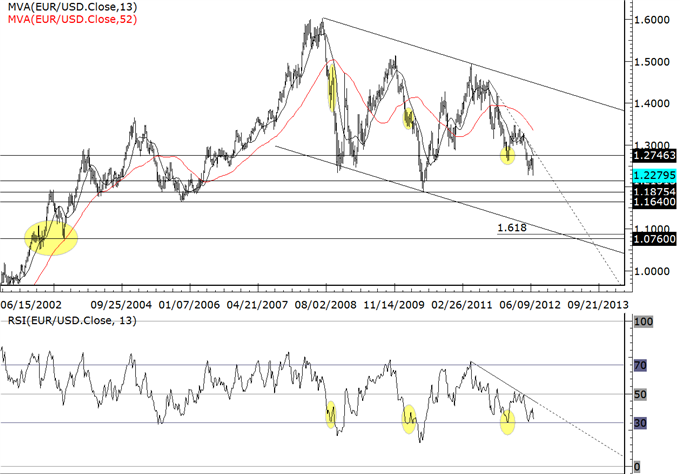
Jamie – The EURUSD traded below the June low today. Allowing for a rally back into 12360-12400, I am still bearish for a drop to 12150 (pivot from late June 2010) and maybe even 12068. Looking out a bit, price is approaching the 2010 and 2005 lows at 11875 and 11640. These levels will eventually give way but near term focus should be on shorting strength into 12360-12400.
British Pound / US Dollar
Weekly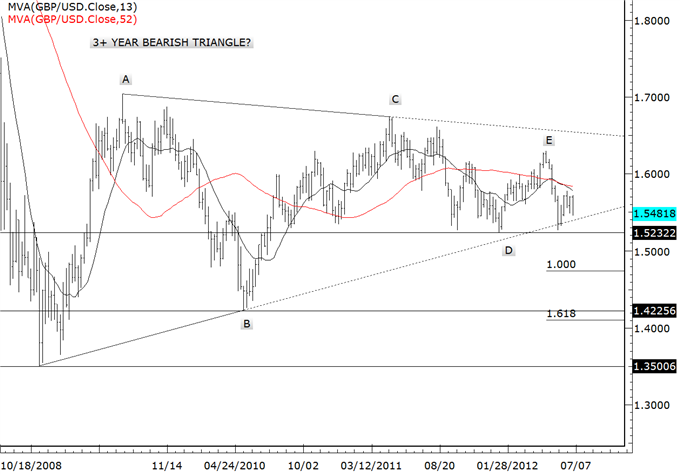
Jamie –On the verge of taking out 15484, GBPUSD focus is on the 100% extension of 15777-15484 / 15721 at 15429. The objective is in line with the 6/1 high at 15438. 15550-15590 is now resistance. Bigger picture, one must consider the potential for a resolution to the 3+ year bearish (previous trend was down) triangle. A drop below 15232 would shift focus to the 100% extension of 16301-15277 / 15777 at 14743.
Australian Dollar / US Dollar
Weekly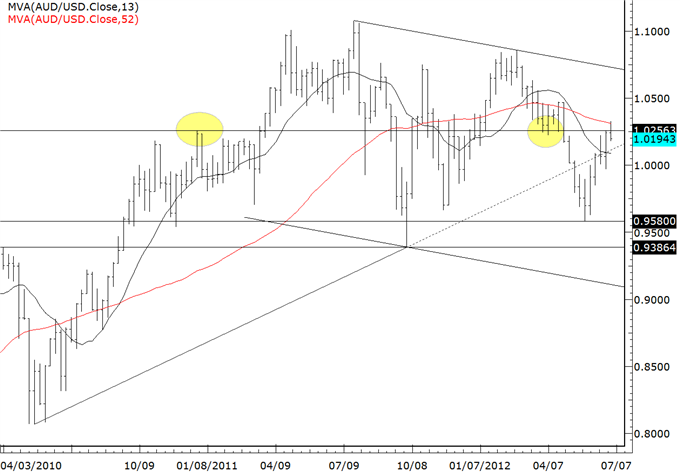
Jamie – Remember last Friday?! I wrote at the time that “I stand by previous comments and am bearish as this level is defended by the 50% retracement of the decline from the February high and 13 week average (52 week average is at 10320).” The AUDUSD reached 10329 before selling off. Structurally, another high (above 10329) and test of 10370/80 can’t be ruled out (61.8% retracement of the decline from 10855 is at 10368…the 61.8% extension of the 9580-10224 rally from 9968 is at 10366…the 12/8/11 high is just above at 10379) before a drop towards 9900. The Asian opening range should help identify short opportunities next week.
US Dollar / Japanese Yen
Weekly Bars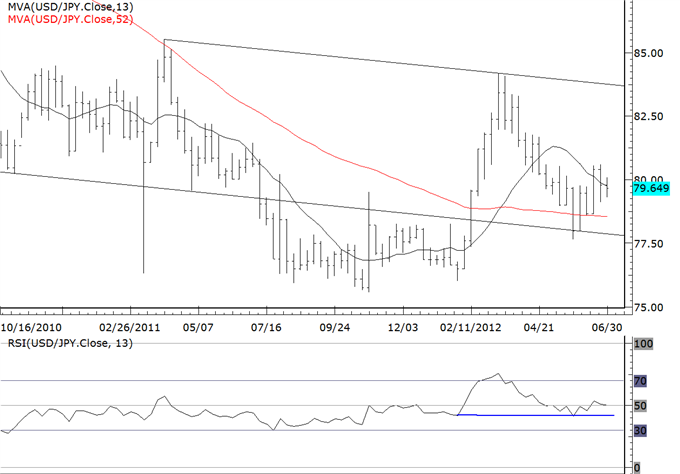
Jamie – “Bigger picture, the USDJPY is trying to put in a low above the February low. The RSI turn at 40 on the weekly is promising in that regard.” The market has done nothing but consolidate since the 6/25 reversal. Consolidation after a bearish reversal isn’t bullish and in fact leaves the USDJPY vulnerable towards 7912. A stronger near term tape is needed in order to act on the long term bullish potential. Stay tuned.
I’ve shown this chart for 3 weeks now (and similar charts since March) but it’s worth a look each week if for no other reason than to remind ourselves that decoupling is a myth; that capital markets remain USD centric and fluctuate with the expansion and contraction of USD denominated credit.
“The story being told by markets remains one of slowing global economic growth. Interest in the story is on the rise as key markets such as crude oil and copper approach multiyear support lines (head and shoulders necklines). The downward sloping neckline on crude portends an especially weak market (Some may take issue with this because these charts are of continuous futures, rather than spot. The crude spot market shows a much higher right shoulder and upward sloping trendline but does indeed show a multiyear topping pattern). Breaks of these long term supports will probably trigger the panic portion of the story in the coming weeks and months.
Of particular interest to FX traders is the emergence of topping patterns in both the Euro and Japanese Yen (Yen futures shown to correlate with EURUSD). Both currencies have been carving out topping patterns since late 2010. Viewed through this lens, it’s not out of the question that we’ll soon see a much stronger USD against both the Euro and Yen (and a more or less sideways EURJPY). Specific to the Yen, the divergence between the Yen (not a new record high) and 10 year Treasury note (new record high) remains in place and is characteristic of long term reversals.”
S&P 500 Index ETF (SPY)
Remember last Friday’s rally? The S&P traded below last Friday’s open today. Early in June, I suggested 2 topping dates based on common time relationships seen at previous tops. The dates were 6/21 and 7/3-7/4. I was confident that the top was in on 6/19 after the 6/21 drop but Ms. Market, always with a trick up her sleeve, had other plans. Once again, the information that I rely on (pattern, sentiment, momentum) suggests that a top is in place. I am more confident this time as the rally from June is 1 day removed from a 50% relationship in time with the decline from April, July’s opening range has been resolved to the downside (which was not the case in June), and daily RSI has rolled over after poking above 60. The only thing that worries me as a bear is sentiment. The mainstream media acts as if the world is ending each time the S&P falls 10 handles. Words like ‘crumble’ and ‘plunge’, usually in capital letters, populate the Twittersphere. This psychology is more consistent with bottoms than tops. By the same token, each 10 handle rally in the S&P brings out bullish prognosticators in droves. Maybe the extreme changes in sentiment over short periods of time presage drastic market moves. The thought fits the Elliott wave model in which the majority sells out at the wave 1 low (after 1-2-3-4-5 down) and gets caught turning bullish at the wave 2 high (after A-B-C up).
S&P 500 Index ETF (SPY)
The red dots indicate days when the market opens UP at least 1.8% and closes the day UP at least 2.5%. The conditions were met last Friday for the first time since December although last Friday is more similar to 10/27/11 in that both days took place one month after lows were registered. Near term focus is on the 6/25 and 6/4 lows about 40 and 85 handles lower. In general, such conditions are more likely to be met in bear markets (as the chart indicates).
US Dollar Index (ICE) Continuous Contract Weekly
I’m still following the 1995/96 USD model. IF the current market follows the 1995/96 model then expect weakness from near current levels. In the event that the current market starts to deviate significantly from the 1995/96 model, then I’ll abandon the idea.
US Dollar Index (ICE) Continuous Contract Daily
The relationship between the US Dollar Index in 1995-1996 and now was pointed out to me by ElliottWave-Forecast. The charts tell the story and it’s uncanny. Not only do the patterns show remarkable similarity in form, but also in time and amplitude. The first number denotes the number of days that the specific leg consumed. The second number in parentheses denotes the number of days since the start of the pattern. The numbers with decimal points are percentage and measure the change from low to high of each leg in the pattern with the number after the slash measuring the net change from the start of the pattern. If the pattern continues (and there is no guarantee that it will of course), then the USD would trade sideways to down throughout July and August before bottoming just above the May low. This should be interesting to follow.”
Australian Dollar (CME) Continuous Contract 240 Minute
The potential AUDUSD capitulation as indicated by elevated CME volume was mentioned yesterday. The high remains in place which increases the confidence in the top and reversal idea.
Dow Jones FXCM Dollar Index (Ticker: USDOLLAR)
Weekly
Jamie – I wrote last week that “the Dow Jones FXCM Dollar Index (Ticker: USDOLLAR) is pressing against the April high at and 13 week moving average. The 40 level acting as support in RSI is a bull market characteristic as well on the daily. Given implications from the SPY analysis and US Dollar 1995-1996 similarity, I’d not be surprised to see a strong USD in early July followed by weakening thereafter. The implications next week are for a move back towards 10200.” The USDOLLAR reached 10187 today. Early week focus is still higher towards 10220/40, which is a zone likely to produce a reaction (at least a pullback lower). 10130/55 is support.
Euro / US Dollar
Weekly
Jamie – The EURUSD traded below the June low today. Allowing for a rally back into 12360-12400, I am still bearish for a drop to 12150 (pivot from late June 2010) and maybe even 12068. Looking out a bit, price is approaching the 2010 and 2005 lows at 11875 and 11640. These levels will eventually give way but near term focus should be on shorting strength into 12360-12400.
British Pound / US Dollar
Weekly
Jamie –On the verge of taking out 15484, GBPUSD focus is on the 100% extension of 15777-15484 / 15721 at 15429. The objective is in line with the 6/1 high at 15438. 15550-15590 is now resistance. Bigger picture, one must consider the potential for a resolution to the 3+ year bearish (previous trend was down) triangle. A drop below 15232 would shift focus to the 100% extension of 16301-15277 / 15777 at 14743.
Australian Dollar / US Dollar
Weekly
Jamie – Remember last Friday?! I wrote at the time that “I stand by previous comments and am bearish as this level is defended by the 50% retracement of the decline from the February high and 13 week average (52 week average is at 10320).” The AUDUSD reached 10329 before selling off. Structurally, another high (above 10329) and test of 10370/80 can’t be ruled out (61.8% retracement of the decline from 10855 is at 10368…the 61.8% extension of the 9580-10224 rally from 9968 is at 10366…the 12/8/11 high is just above at 10379) before a drop towards 9900. The Asian opening range should help identify short opportunities next week.
US Dollar / Japanese Yen
Weekly Bars
Jamie – “Bigger picture, the USDJPY is trying to put in a low above the February low. The RSI turn at 40 on the weekly is promising in that regard.” The market has done nothing but consolidate since the 6/25 reversal. Consolidation after a bearish reversal isn’t bullish and in fact leaves the USDJPY vulnerable towards 7912. A stronger near term tape is needed in order to act on the long term bullish potential. Stay tuned.


No comments:
Post a Comment